I made this YouTube video the other day about how all code, eventually, is abandoned. It doesn't die, because it still exists, but it simply won't have people working on it anymore.
But there's one thing that can prevent it, the code can graduate! It can be that you had an idea so useful that another project, a much larger one, will grab it to run with it.
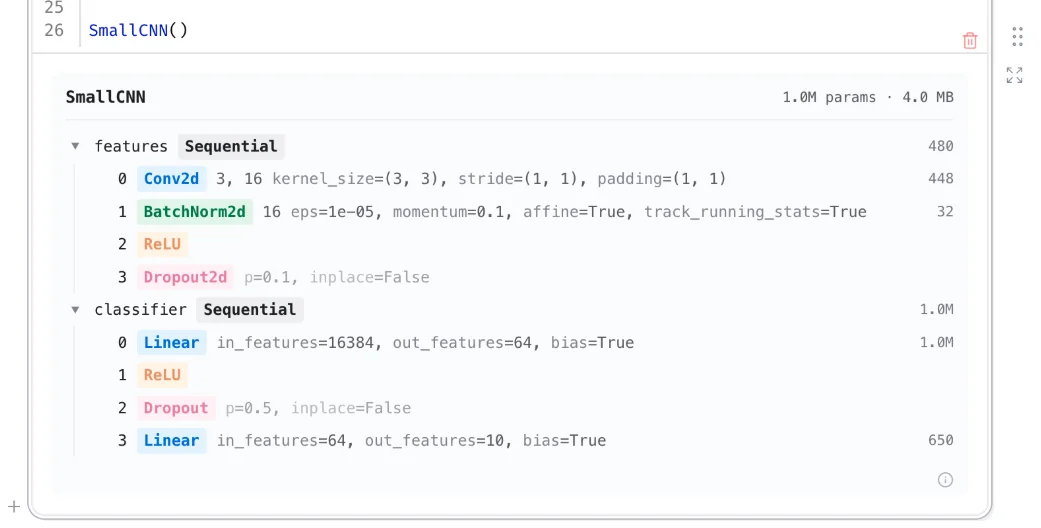
It's happened twice to me. A few widgets from wigglystuff just got ported to marimo just like how a few scikit-lego components (or at least their spirit) have found their way into scikit-learn.
I wish it could happen to more people because this kind of pollination across projects is exactly what keeps the creativity alive.
I work with YouTube for my job and I'm happy to announce that I found a remedy for the extremely distracting landing page. It's a Chrome extension called redirector that lets you add redirect rules to the browser by hand.
Whenever you'd go to the YouTube landing page it'll redirect you to another page. In my case, I make it go to my YouTube subscriptions. Those are way less distracting and typically show me stuff that I've already seen anyway. Much better!
Been thinking about a quote lately. The quote is from the final episode of the first season of Shell Game, which is a great podcast.
As far back as 2013, a team of engineers at YouTube hit upon a phenomenon it called “the inversion”: the point at which the fake content we encounter on the internet outstrips the real. The engineers were developing algorithms to distinguish between authentic human views and manufactured web traffic — bought-and-paid-for views from bots or “click farms.” Like the discriminator in a GAN, the team’s algorithms studied the traffic data and tried to understand the difference between normal visitors and bogus ones.
Blake Livingston, an engineer who led the team at the time, told me the algorithm was working from a key assumption: “that the majority of traffic was normal.” But sometime in 2013, the YouTube engineers realized bot traffic was growing so rapidly that it could soon surpass the human views. When it did, the team’s algorithm might flip and start identifying the bot traffic as real and the human traffic as fake.
Part of why it is in my mind is because it's something to worry about, but it's also an epic nerd snipe for the algorithm designer part of my brain. You need a new breed of algorithm. Not quite classifier, not quite outlier detector and not quite clusterer. Something new.
From this interview I learned about the marketing around Niche. What's interesting here isn't just how the game got developed but also how it eventually got marketed.
It's an indie game and these kinds of games are usually promoted by going to the video gaming YouTubers and getting them to demo/talk about it. This particular game is about genetics though, so the team also reached out to some science channels.
They should be happy they did because it actually turned out that science/education YouTube channels picked it up way more. It also makes some sense when you think about it. There are so many video games out there that the video game YouTubers get to be picky. But those that do science/genetics may not only be more receptive to over it, they will also likely have an audience that the other channels may never reach. Double win!
Feels like a nice marketing reminder. There's usually more than one niche that you can try to appeal to. And the less obvious ones might end up being more meaningful.
A few of my components from wigglystuff have graduated and are now part of marimo. The whole point of the library is to have a place for fun and experimental tools. But after they turn out to be useful they're easy to port into the core project.
That's why, ever since version 0.20.0 you can now directly use the matrix widget, pytorch widget and chart-select widget without installing the plugin.
Any PyTorch module you return in marimo now shows you a proper widget with tonnes of useful info.
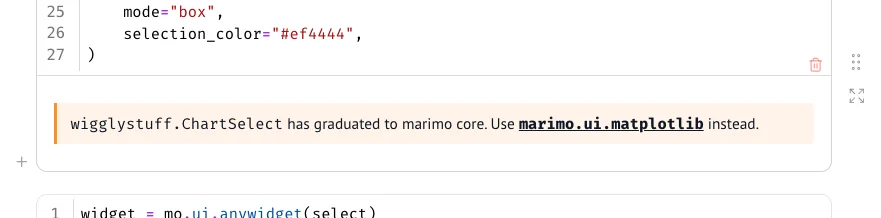
Having these widgets in marimo is great, but it also means that it became time to add a deprecation notice. However, because these widgets can also be used from Jupyter we don't just want to show the deprecation message to everyone. Only to marimo users.
That means that we need to check if the component is being used from marimo. That's easy enough.
try:
    import marimo as mo
except ImportError:
    return
The cool thing though, is that if we know that we are in marimo ... we also know that we are in a browser. And that means we can also do better than just return a Python warning. We can generate a bespoke callout.
from __future__ import annotations


_STYLE = (
    "font-size: 0.875em; "
    "padding: 8px 12px; margin: 8px 0; "
    "border-left: 3px solid #f59e0b; "
    "background: rgba(245, 158, 11, 0.10); "
    "border-radius: 0 4px 4px 0;"
)


def warn_if_in_marimo(widget_name: str, message_html: str) -> None:
    """Render a small graduation hint in the cell when running inside marimo.

    No-op in plain Jupyter or non-notebook contexts so users without a
    marimo built-in alternative are not bothered.

    ``message_html`` is treated as raw HTML so call sites can embed
    ``<a href="...">`` links and ``<code>`` tags directly.
    """
    try:
        import marimo as mo
    except ImportError:
        return
    if not mo.running_in_notebook():
        return
    html = (
        f'<div style="{_STYLE}">'
        f"<code>wigglystuff.{widget_name}</code>"
        f" has graduated to marimo core. {message_html}"
        f"</div>"
    )
    mo.output.append(mo.Html(html))
Now, if you're in marimo, you don't just get text. You actually get to see this gentle callout with a proper clickable link.
“If I finish a book a week, I will read only a few thousand books in my lifetime, about a tenth of a percent of the contents of the greatest libraries of our time. The trick is to know which books to read.”
The beauty of the quote is that it holds for many things, not just books. It also holds for languages, tools, frameworks and any skill you want to have. It also means that you have to say "no" to a lot of books and that you need to invest in your own mechanism to pick the right book.
It also holds true with LLMs. You will never deplete it, and you can't hope to read/use all of the output that it could produce.
The trick, just like with books, is to know which things to ask for.
deno is a modern Javascript runtime that can run Javascript and Typescript natively. But it is also something that's available to all Python users without the need to install node. Thanks to uv, just run uvx deno and you're all set!
I've used it in a project where I want to have some simple unit tests for Javascript via happy-dom but it's also usable as a task runner via uvx deno task build. It effectively let's you skip the node toolchain for a bunch of simple use-cases, it's great!
When you auto-deploy with a bash script from cron, the naive setup is something like this:
* * * * * /path/to/deploy.sh
This deploy.sh script checks if the current git hash is up to date with the main repo. If not, we want to trigger a new build locally and redeploy.
But this has an issue. Cron fires every minute, but docker build might a fair bit longer. Before you know it the second run starts while the first is still building, and now you've got two two builds getting into each-other.
It grabs an exclusive lock on the file /tmp/marimo-deploy.lock.
It runs the command while holding it.
Next, it releases the lock when the command exits.
The -n (non-blocking) flag is the key bit: if the lock is already held, flock exits immediately instead of queueing up. So if a build is still running when the next cron tick fires, the second invocation doesn't run.
One issue with the setup is that the deploy script could hang for whatever reason. So it's best to always add a timeout for this as well.
Feels like a nice pattern for those homelab moments where you don't want a webhook to push into your machine and you want to pull from GitHub on occasion instead.
I've been a huge fan of tailwind for over half a decade. Partially because it's a great library but also because it was cool to see a small team ship and maintain a functional business while maintaining it. It's been tough to see they had to lay off most of their engineers because of LLMs and I was happy to see them get back in the ring with a new product: ui.sh.
The experience of ui.sh is pretty interesting too. From the outset, it just looks like a skill that tells the LLM to be more helpful in design tasks. One of my favorite features is that it can make 4 designs for your site that you can review as part of the feedback cycle. It's a nice touch.
But if they had made a new business out of sharing a few text files they'd be ripe for total disruption again. So instead, the skill points to an MCP that they have full control over. The agent can talk to it, but only if I keep paying for the service.
And that is almost more interesting. The MCP hype never really landed with me, but this setup makes a lot of sense. The MCP lets businesses connect to agents in a way that a CLI never really could. You could find ways to inspect the CLI, but you can't see what's on the other side of the MCP wall.
And if this is a way for great projects to maintain their standing, I'm all for it.
LLMs have a much easier time if it is clear that there is one, and only one, way to do something.
Python, ironically, isn't that. It's too flexible. But a language like Lua is! It only has one container object and it is also delightfully lightweight to run.
And on top of that, it turns out that there's a delightfully minimal, but batteries included, 2d game engine called LÖVE that really gets you a prototype quickly.
So I gave it a spin and it turns out you don't even need to worry about game assets! LÖVE comes with APIs for graphics, fonts, sounds and even music. It's got everything you need to generate all of it!
So basically, with an engine like that, you're getting mighty close to zero-shotting a first prototype. It does help if you have a simple game in mind and if you can point to a variation of an existing game. So I went for the bacteria puzzle from 7th guest. I barely had to explain this game and it could just immediately go for it.
The only thing that I missed while exploring this was a notebook environment for this space. Something similar to what Bret Victor talks about here.
More than anything, that feels mighty tempting to explore some more!