Mean Squared Terror
2020-06-29 This blogpost was edited the day after it got posted. During my morning walk I realised that my code had a glaring bug in the statistics. I was reporting training set figures, not the validation set. I re-ran the system with the appropriate numbers and while the conclusions did not change, some of the figures/numbers did.
When I started in data, many years ago, people were actively working on heuristics. These are rules that could look at data and then make appropriate decisions. In schematics, this was the norm;
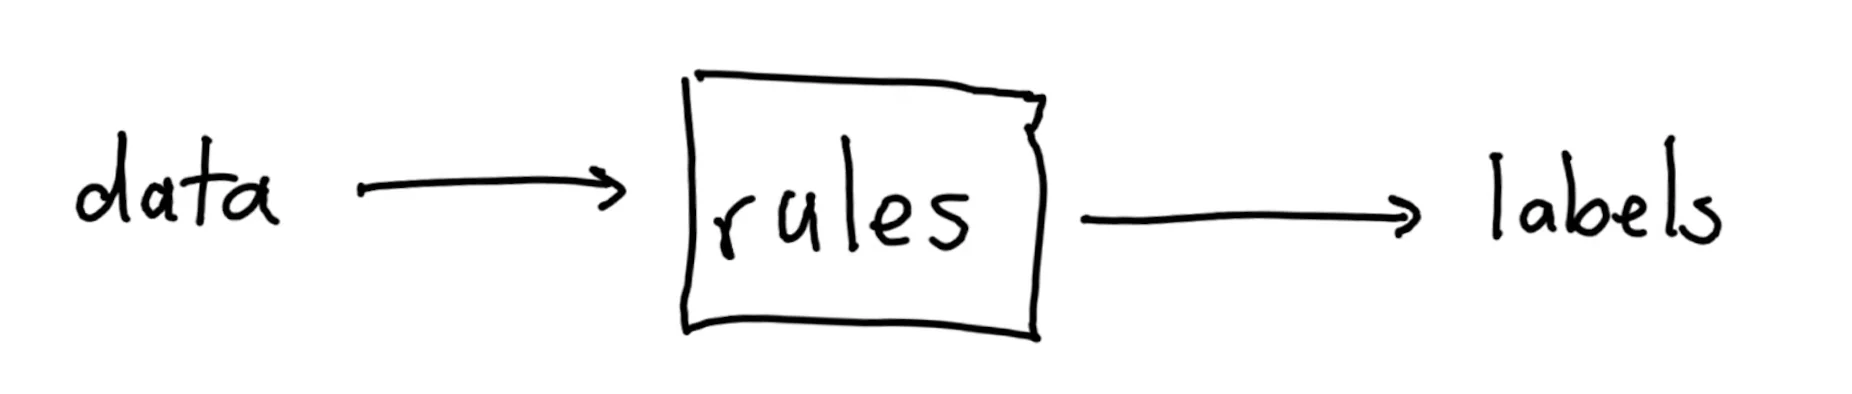
You had to understand the data to come up with these rules and this was very time consuming. But then machine learning changed everything. Instead of writing rules that fit a problem, we provide labels and have a machine figure out the rules instead.
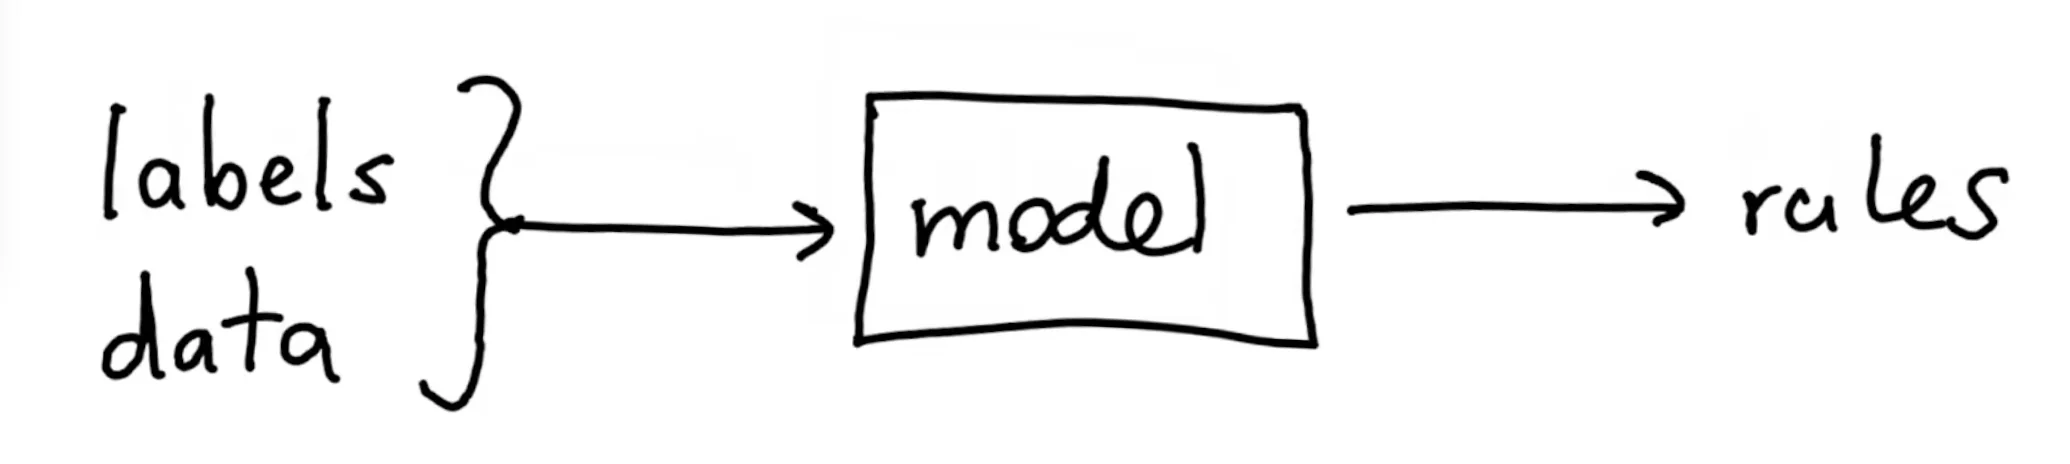
The latter approach has merit to it but it requires a new way of working. It also tends to be compute intensive because we're interested in finding the best possible settings.
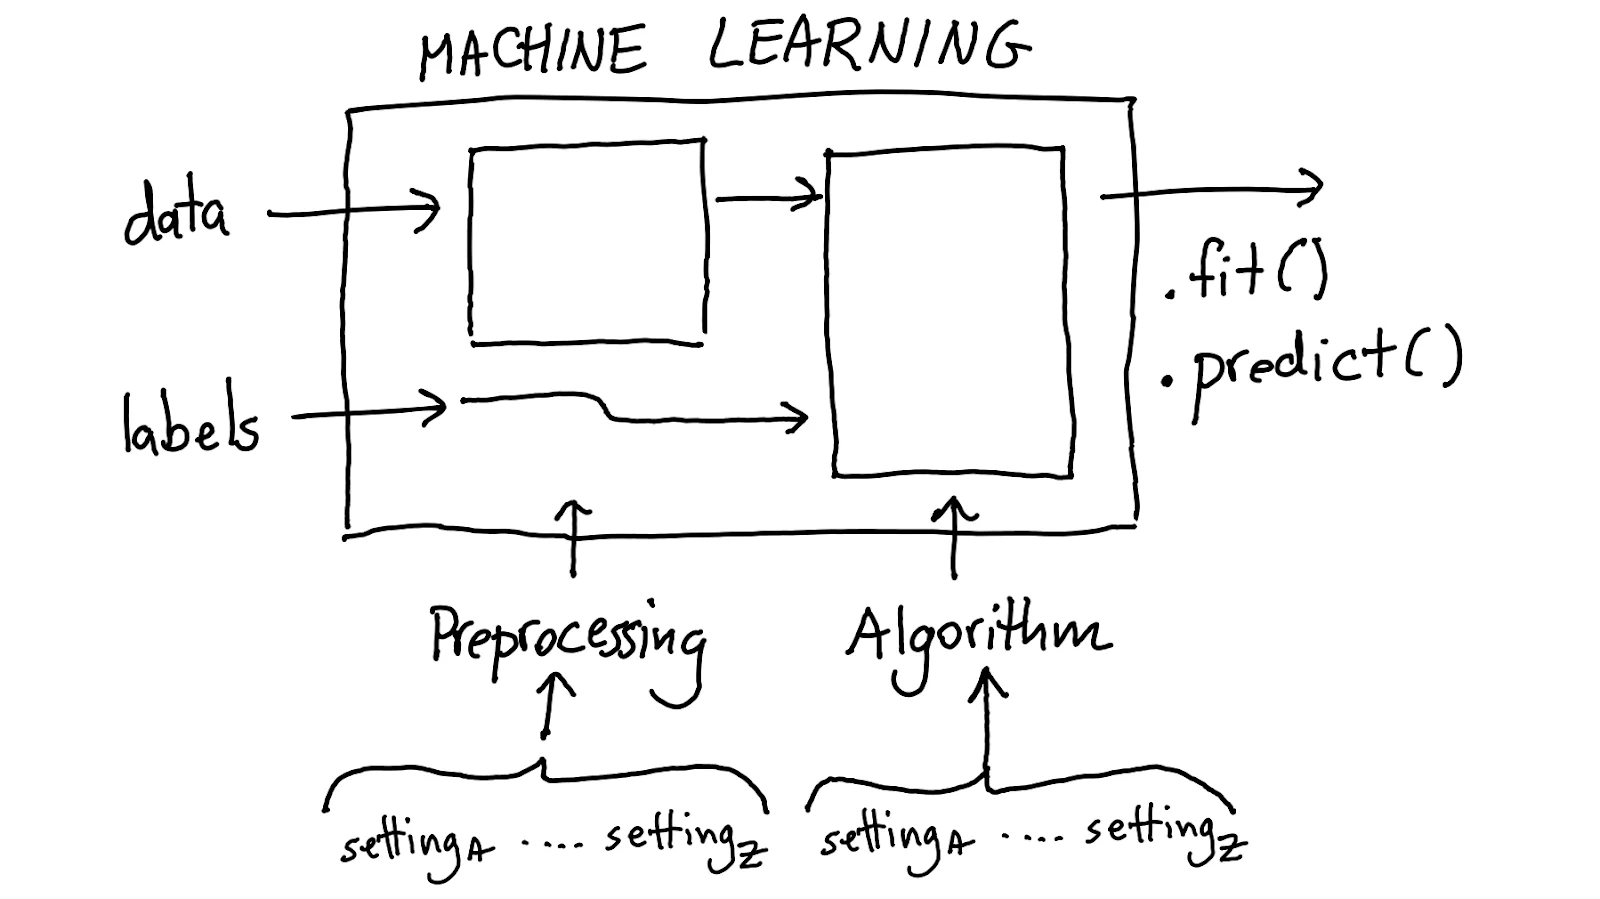
To find the best settings for all of these models we've even got gridsearch via cross validation; an industry standard to make sure that we pick the best model.
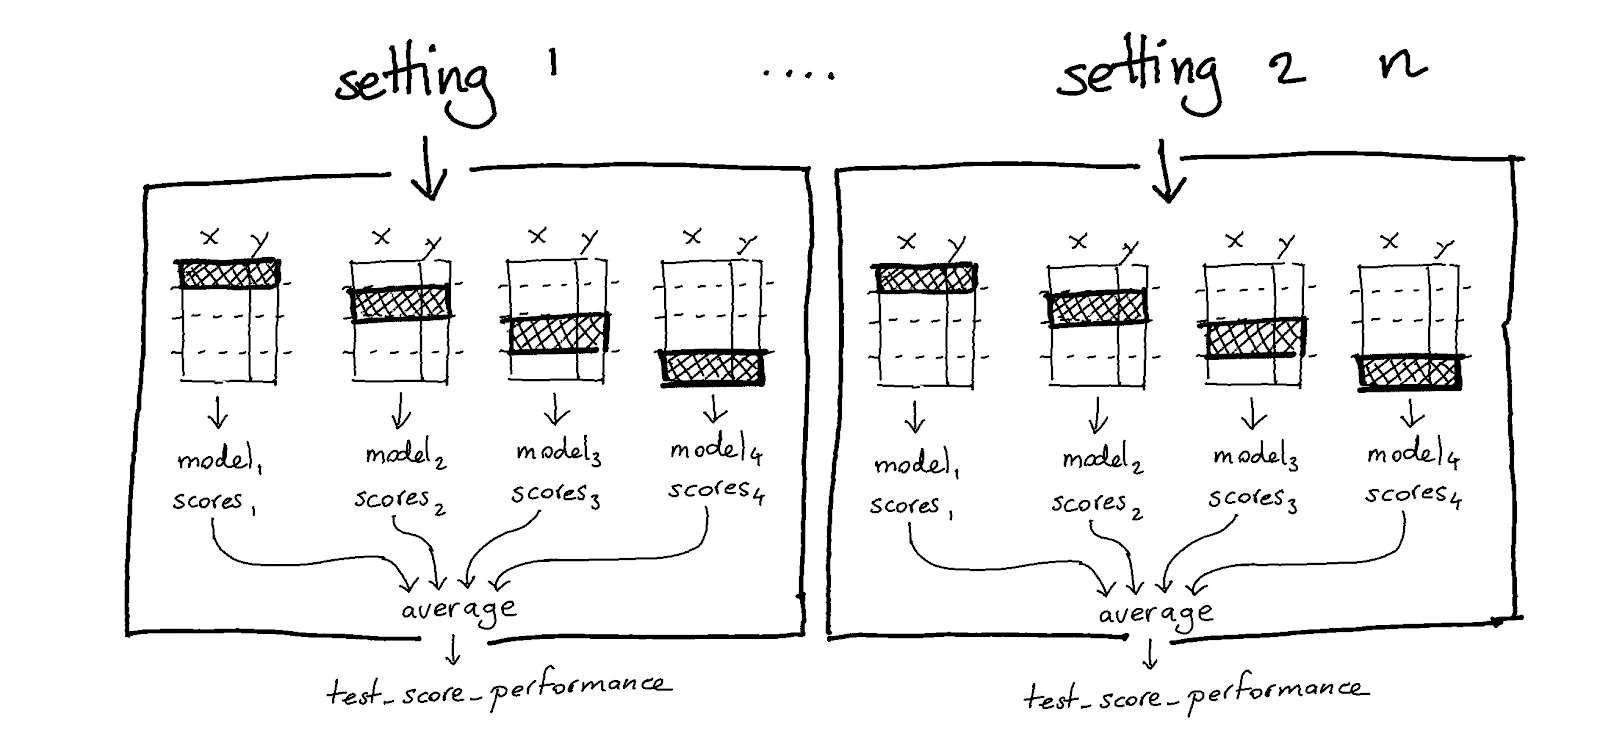
Don't get me wrong, there's merit to the methodology. We want to demonstrate consistent results in our models. But we're representing all the possible properties of a model as a single number. That's a massive reduction of information, and frankly, an overly simplified way to think about models.
Dangerzone
I've written before that "GridSearch is not Enough[tm]" but in this document I wanted to give an example of how the technique can also be a problem. GridSearch is not uust insufficient, it can also be dangerous.
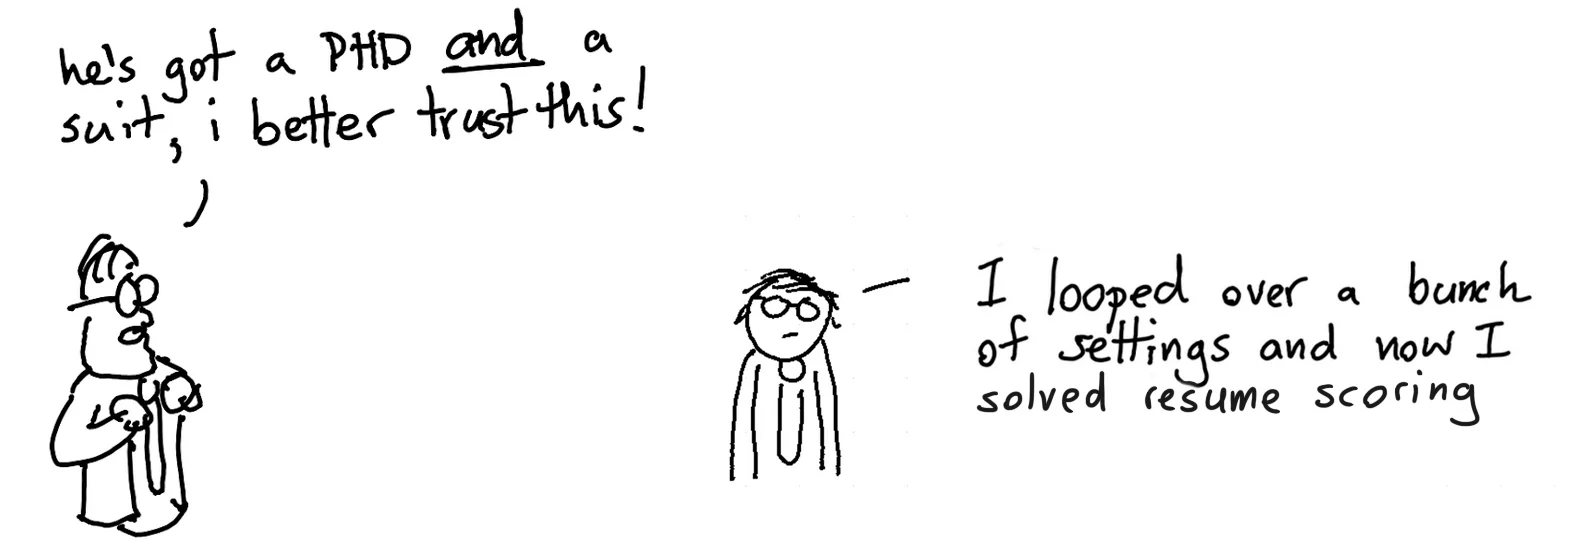
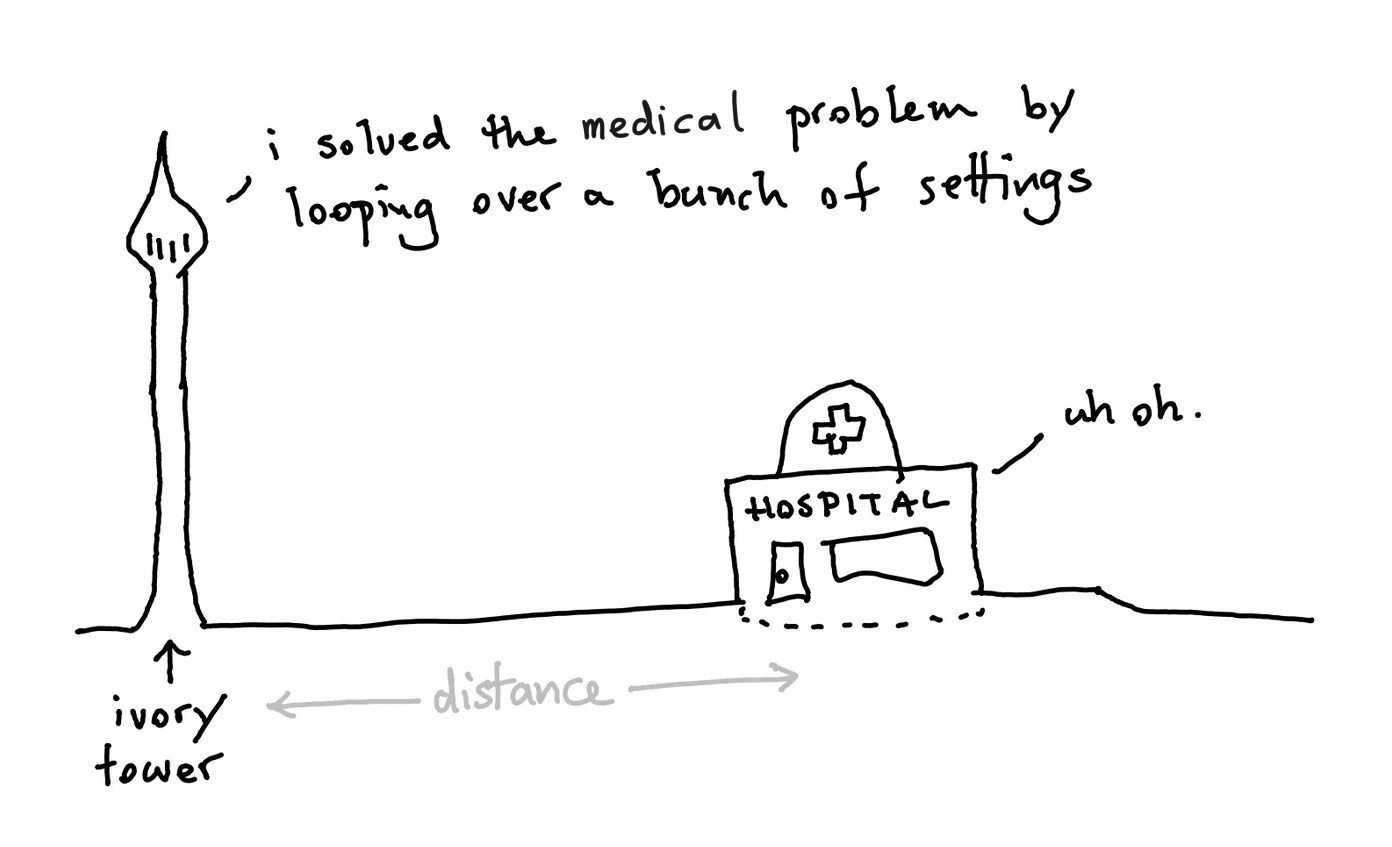
The main reason is that I've seen people put blind faith into the methodology causing a blind spot for other issues with the model. I've also spoken to data scientists who think that machine learning algorithms are unbiased tools that find the "truth" in the data and that grid search is a methodological purity. This is a dangerous attitude so I figured I'd create a counter-example.
Experiment
So let's do a small experiment. The goal is to see the effect of machine learning on a biased dataset. Given a biased dataset, will grid search amplify the bias in the dataset or reduce it?
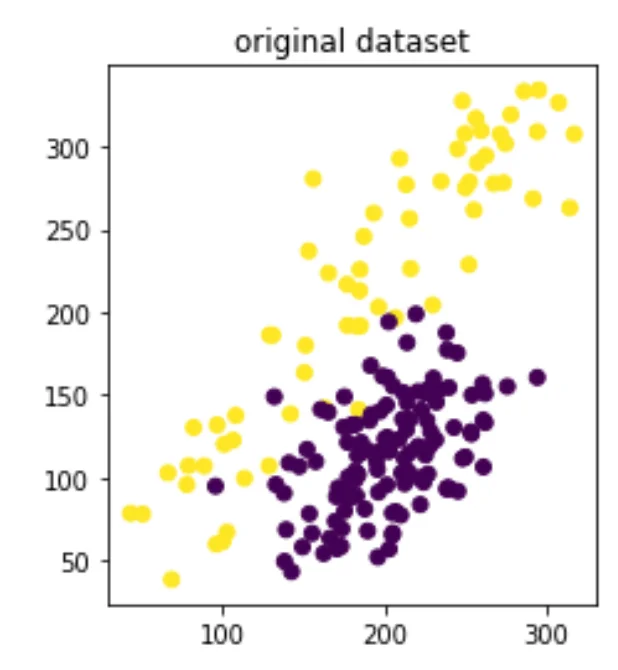
I've draw a dataset using drawdata.xyz. Let's pretend that this usecase represents predicting salaries based on skill level. The skill level is plotted on the x-axis and the salary/reward is plotted on the y-axis. There's two groups of datapoints and one represents a marginalized group. This group is under represented, only appears with low salaries and it also has a lower salary than it's non-marginalised peers. The current illustration is a blunt representation of what might happen in a real life dataset (the bias can be more subtle) but the question is; what pattern will be picked up after grid search?
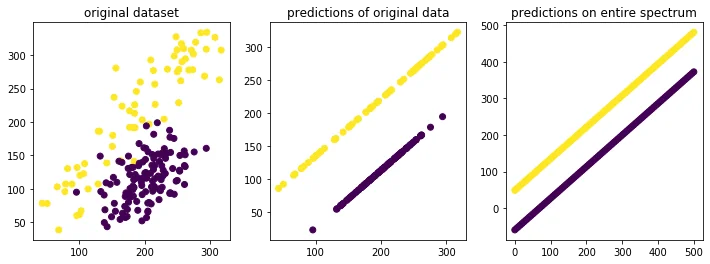
Below we'll have a look at the results of three different models. We'll also list the mean squared error that was reported back to us from the gridsearch.
You can find the code for this work [here](https://gist.github.com/koaning/d9483452693295c97979d6977ccfe3b0).Linear Model with Dummy Variable
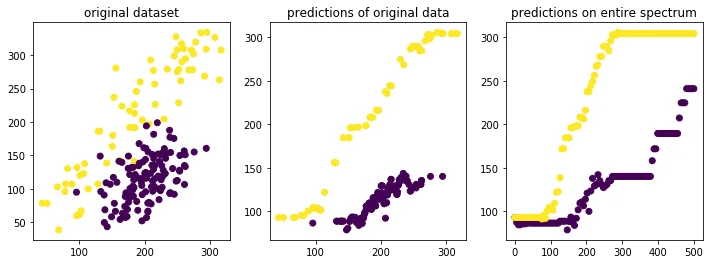
Nearest Neighbor Regression with Scaling
Grouped Linear Model
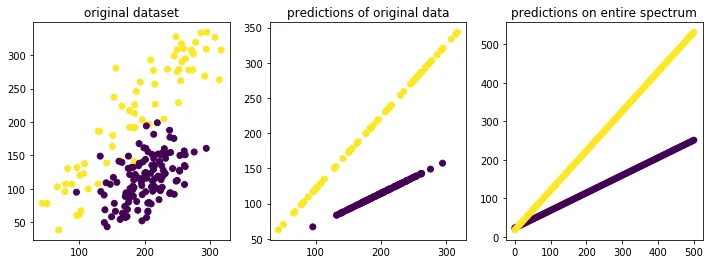
Notice how the model that has the lowest mean squared error is also the model that causes the most bias between groups for higher skill levels. This increase in bias cannot be blamed merely on the data. It's the choice of the model that increases this bias which is the responsibility of the algorithm designer.
Now, you could argue that this is a theoretical dataset. No professional would include something like gender into a model predicting salary. Right? We can repeat the same exercise with something that correlates with a sensitive attribute instead but you can expect similar result. You can get a smaller mean squared error when you can learn the bias in the dataset. No matter how subtle.
This is what I find scary about gridsearch. People have been learned to trust it even though it can pick a model you should not consider. Notice how the grid search would tell us that there should be a big payment gap between the two groups even if they display high levels of skill. In algorithmic terms some might call this behavior "optimal" while in real life, you would call this sexism, ageism or racism.
The thing to remember here is that 100% unbiased datasets don't really exist. This phenomenon of overfitting on a metric is something that gridsearch contributes to. Combine that with algorithm designers who don't have domain knowledge in the domain that they're applying your algorithm to and you might just get this.
!!! quote "Appendix"
This post was prompted by a discussion on [twitter](https://thegradient.pub/pulse-lessons/) as well as a discussion
on [linkedin](https://www.linkedin.com/feed/update/urn:li:activity:6679637058597789696/?commentUrn=urn%3Ali%3Acomment%3A(activity%3A6679637058597789696%2C6679704886969475072)&replyUrn=urn%3Ali%3Acomment%3A(activity%3A6679637058597789696%2C6679775009537343488)). It's dissapointing to see data professionals be dismissive of how bias is amplified by algorithms.

This is not something the profession should be casual about.